Monitor Key Microsoft Price Points Amid Stock Surge Driven by AI Cloud Expansion
Key Highlights on Microsoft’s Stock Performance
Microsoft’s Recent Financial Success
Microsoft (MSFT) experienced a significant increase in its stock price during after-hours trading on Wednesday. This rise followed the company’s release of its fiscal third-quarter results, which exceeded expectations set by Wall Street analysts. The robust growth of Microsoft’s cloud services, particularly its Azure platform, was a major contributor to this success.
According to CEO Satya Nadella, the strong performance in the Intelligent Cloud segment reflects the increasing demand from businesses aiming to improve output, cut costs, and foster growth. Microsoft’s ongoing innovation in artificial intelligence has also played a critical role in bolstering its market position.
While Microsoft shares have climbed approximately 15% from their low in April, they remain 6% lower than their price at the beginning of the year. Like many tech firms, Microsoft faces headwinds from concerns about potential tariffs and a reduction in overall AI investments, which continues to affect investor sentiment.
Understanding the Stock Movement
In after-hours trading, Microsoft’s stock rose nearly 7%, reaching about $423 per share. To gain a better perspective on this movement, it’s essential to apply technical analysis to Microsoft’s stock chart.
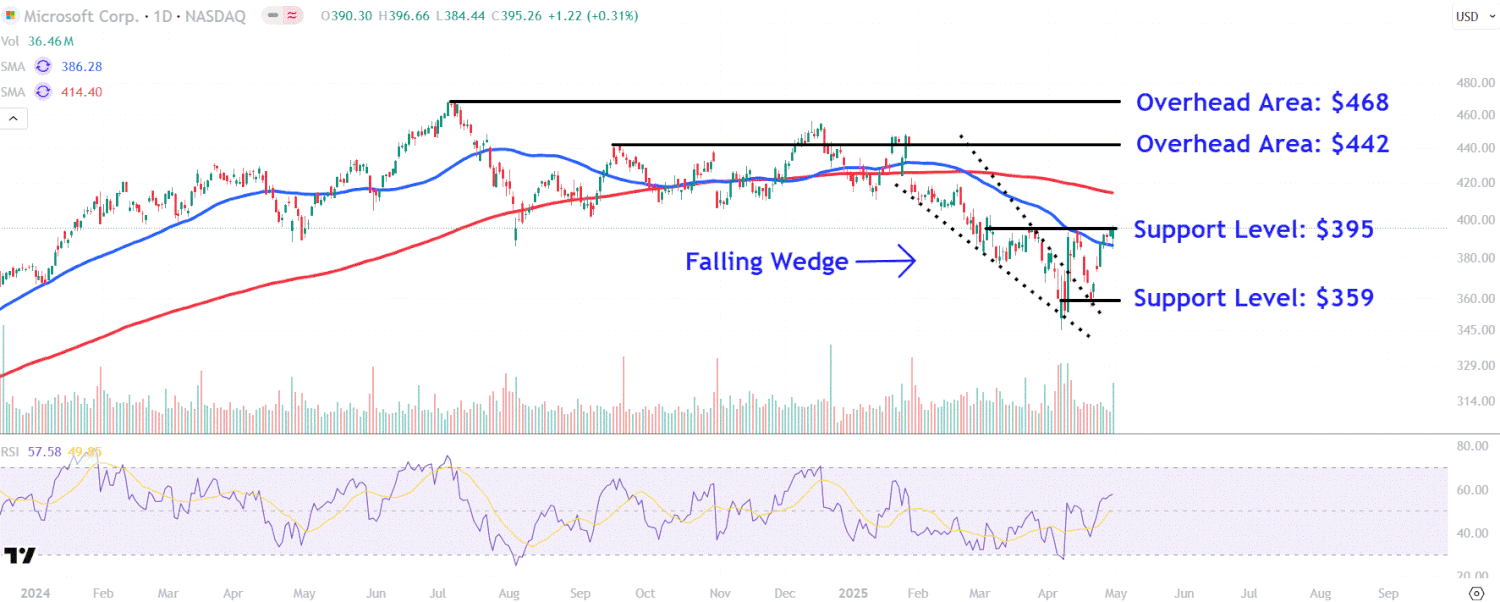
Successful Retest of the Falling Wedge
A notable event for investors was the successful retest of the upper trendline of a falling wedge pattern, which is a technical indicator that could signal a potential bullish reversal in the longer term. Following this retest, Microsoft shares experienced a substantial upward movement leading up to their earnings report.
Volume and Investor Activity
On the day of the earnings announcement, Microsoft shares recorded their highest trading volume in three weeks. This uptick in volume indicates strong interest from larger market players, including institutional investors and hedge funds, who were likely anticipating a significant price movement after the earnings report.
Key Price Levels to Monitor
Overhead Resistance Areas
Investors should keep an eye on two important overhead price levels for Microsoft:
- $442 Level: This level serves as a potential resistance point, aligning with a trendline connecting multiple price peaks observed between September and January.
- $468 Level: If Microsoft can decisively break above the $442 resistance, the next target could be the $468 area. At this point, investors who purchased shares at lower prices might consider taking profits, especially since this price is near the stock’s all-time high recorded in July of last year.
Crucial Support Areas
As the market fluctuates, it’s also crucial to identify support levels that may affect future stock performance:
- $395 Level: Investors should closely monitor the $395 mark, which is near the closing price on Wednesday. This price level has acted as a selling point over the past month, particularly following significant peaks in March and April.
- $359 Level: Should the stock undergo a more pronounced decline, $359 could serve as a lower support level. This represents a strategic buying opportunity for those looking to invest, situated just above the significant low observed this month.
By understanding these key price levels, investors can better navigate Microsoft’s stock fluctuations amid ongoing market developments. Continuous monitoring of these indicators will provide insightful guidance for making informed investment decisions.